Chromogram is a visualization technique for revealing patterns in a large sequence of text data. While working with Martin Wattenberg and Fernanda Viégas, we applied this technique to individuals’ contributions to Wikipedia. The first three letters of an article title or comment are respectively mapped to a hue, saturation, and brightness range, revealing patterns of editing and repeated tasks.
Chromogram revealed some alphabetical editing sequences for many editors, in particular editing bots (including user Pearle, shown above). Wikipedia bots assist editors by performing clean-up tasks for articles that have been marked with various flags by editors.
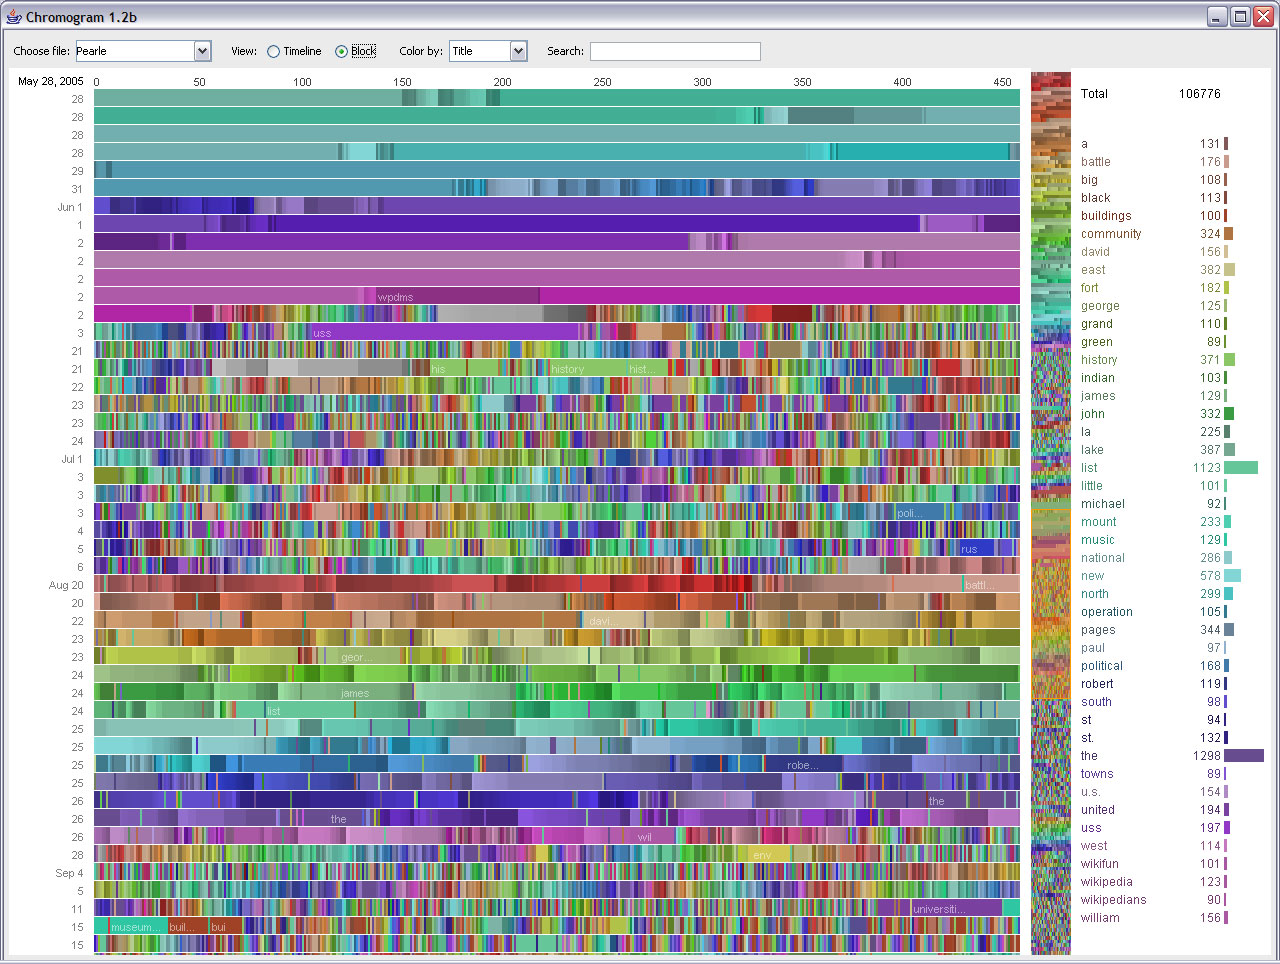
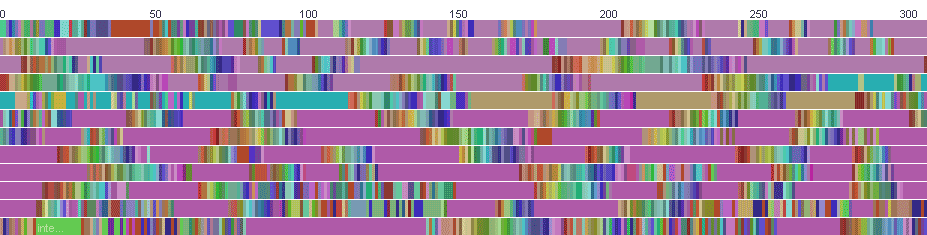
The color mapping algorithm is applied to two data points in edits to Wikipedia: article titles and comments accompanying the edit. Toggling between views revealed different patterns. In the sample below, an editor appears to alternate between editing similarly titled pages and an alphabetical sequence of pages.
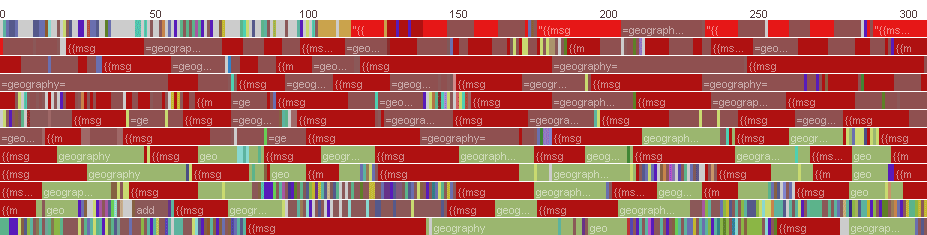
Switching to the comment view (see below) reveals the the user alternates between participating in discussions with other editors and then contributing the geography section of articles. The editor creates map images and then links to them in other articles, which is a common pattern for many contributors.
Martin and Fernanda have a detailed description of Chromogram & our study of Wikipedia editors on their site, hint.fm. >>